
The Simple Event Dashboard shows a listing of events in a grid. Users can click on the headings to sort, mouse over to see the Synopsis, and click on an event to get more information and register.
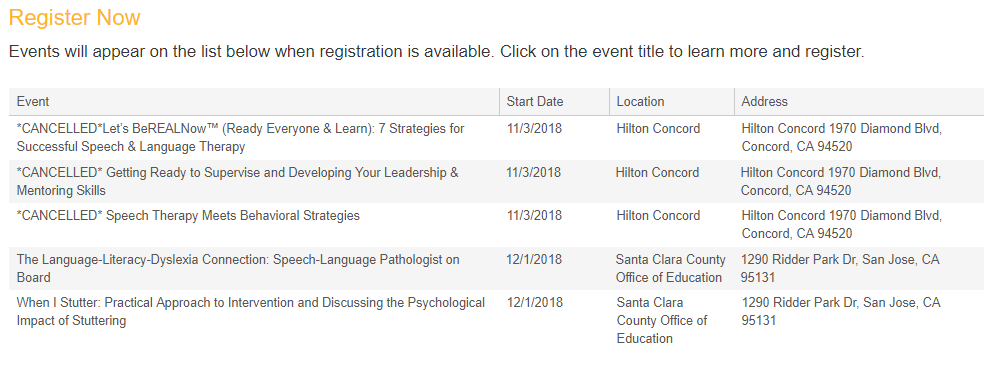
When the NOAH Events module is set to EventDashboard you will have many options as to how the grid displays.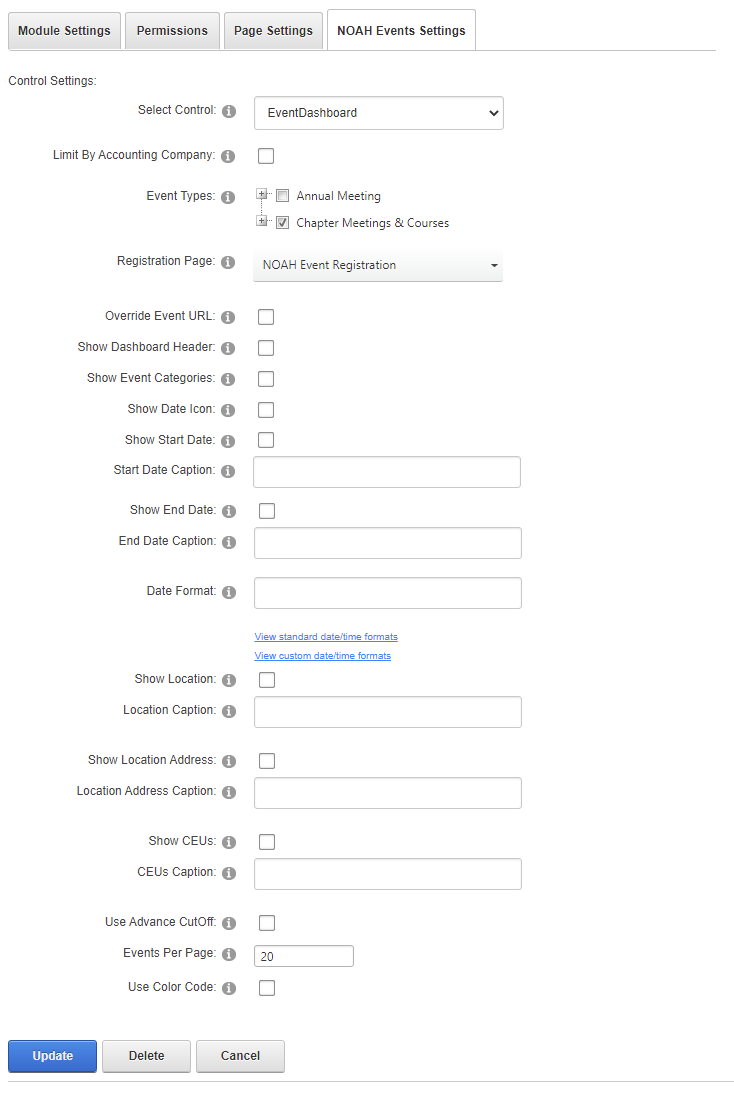
The control now has several configuration options to choose from
- Limit By Accounting Company will only display events for the Accounting Company set by the skin, or missing that, the default accounting company for the website when checked. If not checked it will show events across all Accounting Companies. NOTE: if you have events in multiple Accounting Companies, you will want to set the Optional URL on the Event setups in the AMS to point to the correct registration page as the user will need to purchase the registration in the correct shopping cart for the related Accounting Company.
- Event Types and SubTypes (by clicking on the plus to expand the type) are displayed in this widget by checking the appropriate boxes.
- Registration Page is the page on your website where one would register for a displayed event. Note: this page will have also have the NOAH Events module on it, but set to EventReg.
- Override Event URL, which an be selected if you wish to ignore the Optional URL identified in the event setup.
- Show Dashboard Header- Select if you wish to turn on the header in the dashboard grid.
- Show Event Categories- Select if you wish to turn on event categories (event SubType) filter in the dashboard grid. Label caption is from page layouts using WebCaption.
- Show Date Icon- Select if you wish to turn on event date icon in front of the event title in the dashboard grid. This icon will display day and month of the event.
- Show Start Date- Select if you wish to see event start date in the dashboard grid.
- Start Date Caption- Enter the caption for the event start date, if you want to override the default of Start Date.
- Show End Date- Select if you wish to see event end date in the dashboard grid.
- End Date Caption- Enter the caption for the event end date, if you want to override the default of End Date.
- Date Format- Enter date format string if you'd like to override the default date format for date fields. The default is short date format, or d (m/d/yyyy), so February 15, 2025 would be shown as 2/15/2025. If you chose f, that would show the full date format as Saturday, February 15, 2025 12:00 AM. There are two links shown so you can look find the format you want:
- Show Location- Select if you wish to see event location in the dashboard grid.
- Location Caption- Enter the caption for the event location, if you want to override the default of Location.
- Show Location Address- Select if you wish to see event location address in the dashboard grid.
- Location Address Caption- Enter the caption for event address, if you want to override the default of Address.
- Show CEUs- Select if you wish to see CEUs in the dashboard grid.
- CEUs Caption- Enter the caption for CEUs, if you want to override the default of CEU.
- Use Advance CutOff- Select if you wish to use the Advance CutOff date instead of the Start Date.
- Events Per Page- Set how many events to display on one page (1 - 50), the default is 5.
- Use Color Code- Select if you wish to use event category color coding in the dashboard.
The Dashboard can display different background colors based on the Event SubType. These are defined in the Meetings Dictionary, using the COLR= instruction on the MasterCode of the Event SubType. For example COLR=#FFC0CB would set the background color to pink. Similarly, the LCLR= instruction can be used to define the link color associated with an Event SubType.
NOTE: They styling of your site may override these color settings.